Now, when I get a rough set of filters built...I'll usually start looking for stocks that I want to pick up in the system. I do in this in two ways. The first is by using stocks that I've experienced the idea I'm trying to develop with. And I shared those with you in the first post. The second thing I do is run a quick backtest on a small subsection of the market to see what other stocks it's selecting. And to get a rough idea as to how on the mark the filters I'm using work.
Typically, I'll use the Nasdaq 100 to test with in the very beginning. Yes, I know...the Nasdaq 100 is a current snapshot of the Nasdaq 100. And it is the cream of the crop of stocks in the Nasdaq Exchange. So, if I'm looking for big gainers in the past...well the current Nasdaq 100 has them (and only them). In other words...the dice are loaded. But, regardless of these loaded dice I'm rolling with...using these stocks help initially in the test...let's me know just what the filters are picking up. And helps me find more examples to use in my development.
So, here are the results of the first test on the Nasdaq 100:
Win Ratio: 69.23%Actually, not bad considering it's a first run. The profit factor of 12.54 is really nice considering I typically receive profit factors on first runs in the 5 to 8 range...if the idea has merit. Maybe we're on to something? :)
Avg Profit: 180.34%
Max Consecutive Winners: 8
Avg Loss: -30.68%
Max Consecutive Losers: 2
Max Drawdown: -8.12%
Profit Factor: 12.54
Here's some example trades from the backtest:
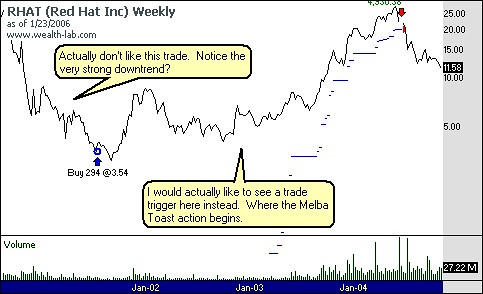
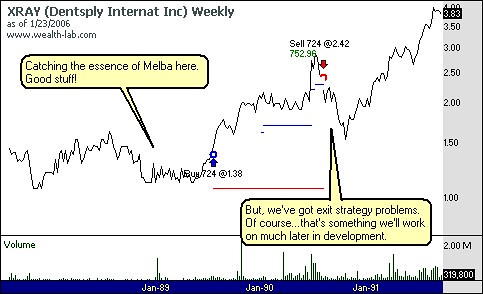
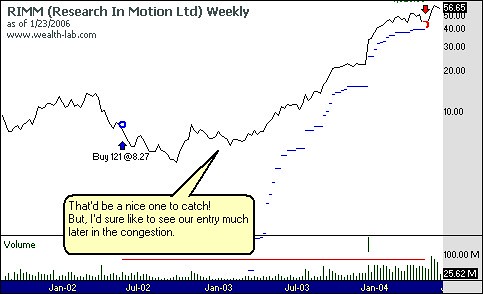
As you can see...some potential...but for the most part we're catching the stock a little too early in the process. I'm also worried that we might be filtering down too much. So, for the next test we might open the filters, especially the average price - the max closing low piece. Maybe less than 1 ATR is a bit too tight. We'll see. Until then...
Later Trades,
MT
5 comments:
Do you have have the Wealth-Lab code on the Melba Toast system? I'd like to play with it myself.
I just started a backtest demonstration on my site and I read your comments on FickleTraders site and followed them here and you are doing something similiar. I will continue to keep myself abreast of your developments.
Hey Dave, thanks for reading. I've decided not to share code and will withhold some specifics in the indicators and data that I use in blogging about the Melba Toast experiment. Namely, due to some of the edges that I maintain across all my systems. For example, the initial specifics of the Melba Toast system discussed a "no uptrend" in place condition. There is logic I use across all systems to determine trend or lack thereof. I'm afraid I can't share that...although through blogging I may post ways (indicators, etc) to determine trends that most people don't typically think of.
For example, I have commented about TraderMike's T2108 indicator and its potential uses as a trend indicator instead of OB/OS
here in the comments
By the way, I've read your post regarding your agreement that technical analysis setups and exits don't work. Never forget Nassim Taleb's Black Swan theory...just because you cannot find or create systems that beat the market...doesn't mean they are not out there.
I also checked out your crossover system post. When adding commission costs and slippage...the results would most likely not beat buy and hold. Plus, the survivorship bias as you mentioned would play a pretty big role in this system's performance. Ways to improve? Think about general market filters...use the QQQQ to determine OB/OS or Trend strength. Maybe use a crossover for the entry setup...but use a different way to exit. Or maybe use the crossover as a filter...and use a different setup to enter. Maybe instead of going long the success of the pattern...you would go short the failure of the pattern. Change timeframe from daily to weekly or even monthly. The variations are truly endless.
And finally, I do not set out to beat the market with one system. Each system trades a specific condition in the market and if you take that system and compare to buy and hold of the market...it will not beat the market. But, build several systems that each trade a specific condition and combine together along with money management and position sizing rules. Not only will you beat the market...but your theoretical risk will be reduced...if correlated correctly.
There's a thread over at EliteTrader that showcases some of what I refer to here
. Provides a great illustration on how to combine multiple systems. Along with various aspects of designing and testing systems.
Take care,
MT
Dave, one more thing to think about. Survivorship bias improves your crossover system...but also improves your buy-and-hold results.
MT
Michael,
W/apologies if I missed this...
What was the time period of your test?
What was the annual ROR?
And, the max drawdown?
For further research, what about combining the price screen (Melba Toast) with a fundamental screen (e.g. one of John Dorman's portfolios from his Bloomberg column)?
JW
Hey Jay, thanks for writing.
The time period of test was basically all the data that I had. My dataservice (Telechart) goes back on some stocks to the late 80's. Of course, the majority of the data covers the late 90's through current. This is good and bad of course...because of the bubble building and busting nature of the times. Would be nice to test over the congestion years (70's)...i.e. the trendless period.
The annual ROR I didn't post...mainly because I don't use that as a validation variable in my tests. The annual ROR is influenced greatly by position sizing formulas. I prefer mainly to use profit factor and win ratio in my test evaluation. Profit factor for capturing the edge and win ratio to see if I can trade it (can't handle losses as well as most). Note: Position sizing influences these too...just not to the same degree as ROR.
I will post the ROR later on in the system development process...once we get to position sizing the system.
Max drawdown is -8.12%. Which is highly optimistic.
A big thanks to you on the fundamental screen idea. That is definitely a good idea. I have been looking for a way to bring fundamentals into the picture with my systems. And because I do not have access to historical fundamental data...I have not been able to do so. But, I believe the type of screen you are referring to I could obtain from back issues of some magazines?
Maybe that might be a direction to take when the system gets closer to completion. Next week I'll take a look at my local library to see if there are some screens posted every year in magazines. Also, I may try contacting Dorfman to see if he would share the past yearly stock selections from his screens...so I could obtain a portfolio to backtest with. Again, great idea!
Take care,
MT
Post a Comment